
News
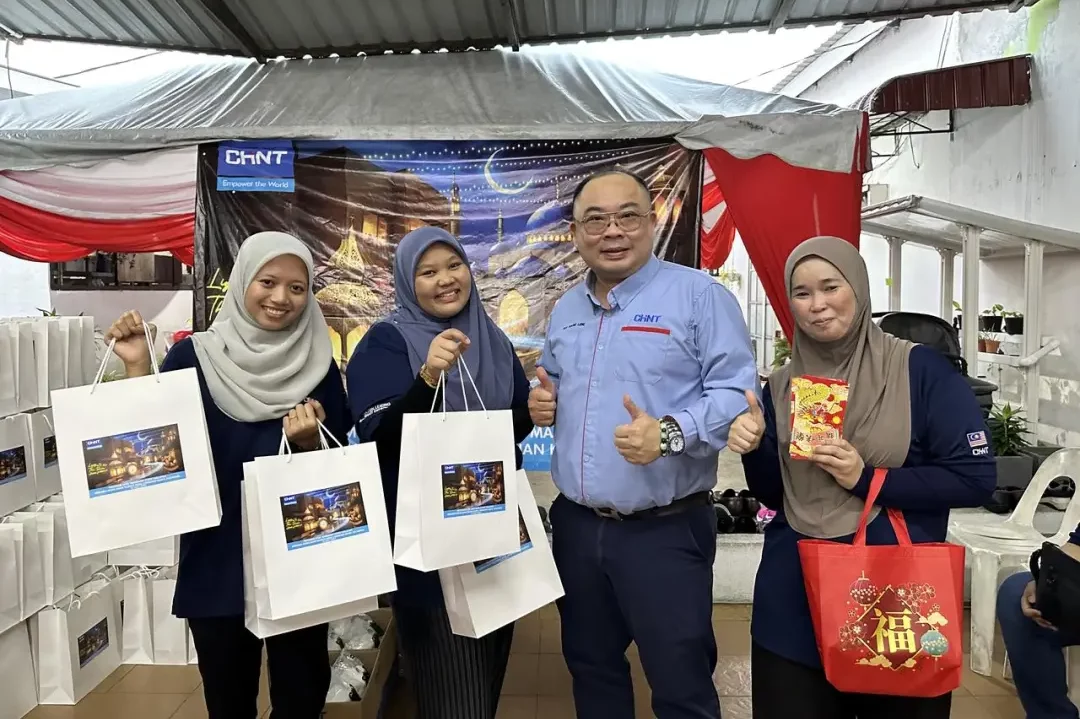
CHINT Embraces Diversity and Spirit of Ramadan with Gloabl Event
Explore CHINT Global’s ‘Lighting the Way this Ramadan’ campaign, showcasing a multinational initiative fostering inclusivity, community development, and sustainable solutions across six countries.
News
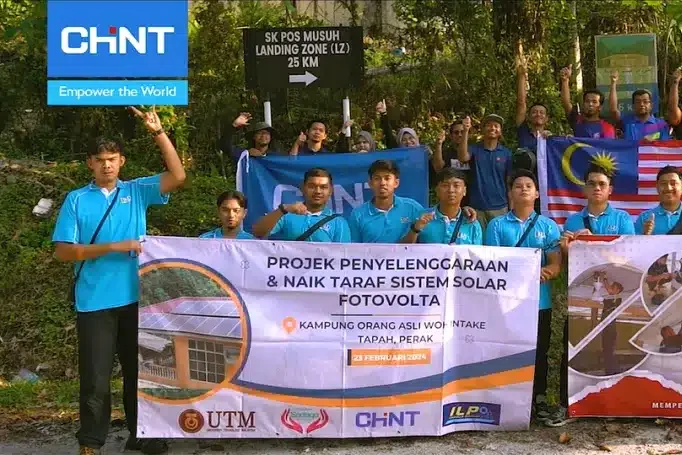
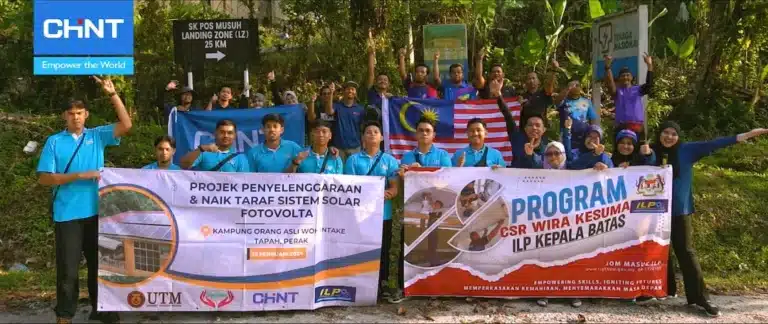
CHINT Global Levels up Village Life in Malaysia
CHINT Malaysia in collaboration with UTM and ILP Kepala Batas, empowers Malaysia communities by providing solar PV systems and essential resources to enhance villagers’ quality of life.